DIGICheck
Test, Measurement and Analysis Tool for RME Audio Interfaces
The Secret Weapon of High Resolution Audio Measurements
RME Audio interfaces not only provide you with a professional digital audio interface, but also with a unique software tool: DIGICheck, for metering, testing, measuring and analyzing digital audio streams. 2, 8 or all channel level meters with countless options. Spectral Analyzer, Goniometer and Bit Statistics in professional quality. Even Channel Status readouts are possible. Under Windows DIGICheck also offers a global record function and the direct readout of playback data. Available here for free download!
This TECH INFO describes the functions and the technology used in DIGICheck. Please be aware that DIGICheck works with Windows and Mac OS X, but only with hardware from RME. This is due to special implementations within the hardware, that aren't available with any other card. RME interfaces are based on RME's own chip design (realized in a FPGA). Because of this you won't find any other card in the market that gives you a Channel Status display, a 100% accurate 24-Bit level meter, a decoding of the CD-subcode, and hardware based RMS calculations.
The Software DIGICheck
The software is very easy to use, well designed, useful, and includes many valuable options. A detailed online help and technical reference is also included.
In the beginning DIGICheck worked like any other record software, opening one or multiple devices for recording, but not writing the incoming data to disk. Therefore DIGICheck only worked as long as no other record program used the selected devices.
The Functions in DIGICheck
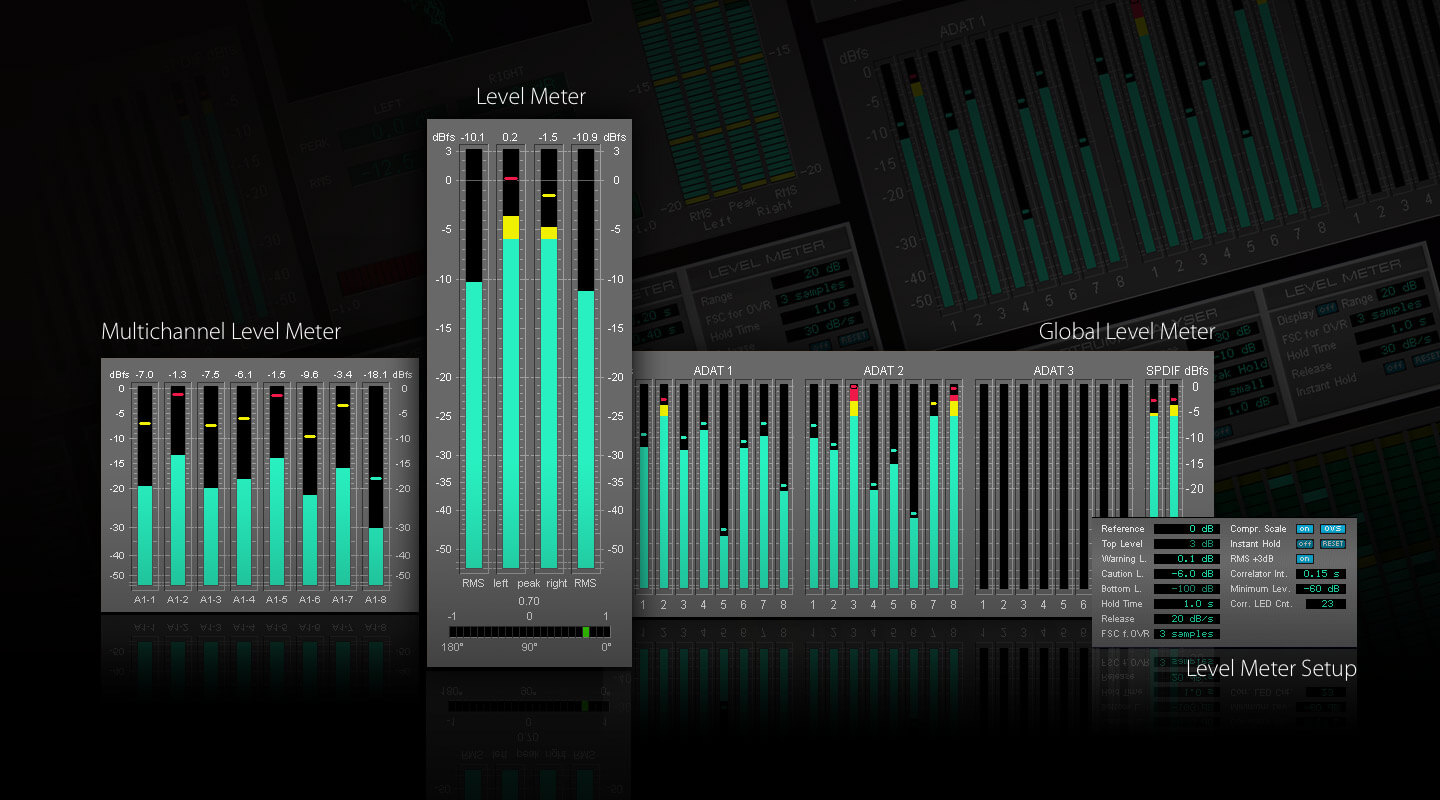
Level Meter
This function provides highly precise level meters with 24-Bit resolution. All parameters like range, resolution and color are completely configurable without limitations in 'Level Meter Setup'. Because of the highly configurable parameters the Level Meter is ready for a great number of applications:
- Peak level measurement
- RMS level measurement
- Over detection
- Measurement of the correlation (phase)
- Measurement of dynamic and signal to noise ratios
- Display of the difference between RMS and Peak (volume)
- Long term peak detection
The peak level (AC+DC) is shown in the inner bars. Every single sample is used for computing Peak level and RMS level. A single sample is sufficient for a 0 dBFS readout. Overs are indicated when more than a user defined count (1 to 20) of consecutive full scale samples occur. A Peak Hold function with adjustable hold time (0.2 s to 100 s) is also implemented.
The RMS level (only AC) is shown in the outer bars. The reference (0 dBFS) is a sine with digital full scale level. This allows easy comparisons of RMS and Peak with usual signals. The RMS display is based on a mathematical true calculation of the root mean square, and will therefore display highly (!) accurate values.
Thanks to 24-Bit the meters break down the lower barrier. Finally you are enabled to see the real dynamics of your equipment! And we don't make jokes: The RMS levels shown from DIGICheck equal exact (!) the values measured by 10.000$ audio measurement systems! To be more specific they equal RMS unweighted, which means RMS without any special weighting filter. To achieve a better readability at lower noise levels we recommend to set the release rate to 10 dB/s (or to use the Bit Statistic instead, see below).
Multichannel Level Meter
Besides the 2-Channel level display also an 8-Channel level display is available. This Multichannel Level Meter uses the same settings options as the 2-Channel Level Meter. The bar can be set to display RMS or Peak.
Global Level Meter
DIGICheck's Global Level Meter displayes all available channels of the the interface simultaneously. This function is mainly intended as fast overview of current configuration and input signals. Channels with invalid input signals will be greyed out.
Level Meter Setup
The visible display range can be set between 0 and -160 dBFS. The measurement includes the whole range available from the received audio bit resolution, displayed in 0.1 dB steps. The change in color is defined in 'Warning Level'. Set to 0 dB a color change is only performed on the highest peak hold step - when 'Over' is detected. The number of consecutive full scale samples for an 'Over' indication can be defined between 1 and 20. As the display of a phase relationship makes no sense below a certain threshold the correlator's display will be turned off. The number of LEDs in the Correlation Meter is also configurable in a wide range.
Channel Status Display / User bits
This function decodes and displays the channel status information contained in the SPDIF signal. In addition the real sample rate is measured with an accuracy of ± 100 Hz. A printing function provides a hardcopy of the channel status.
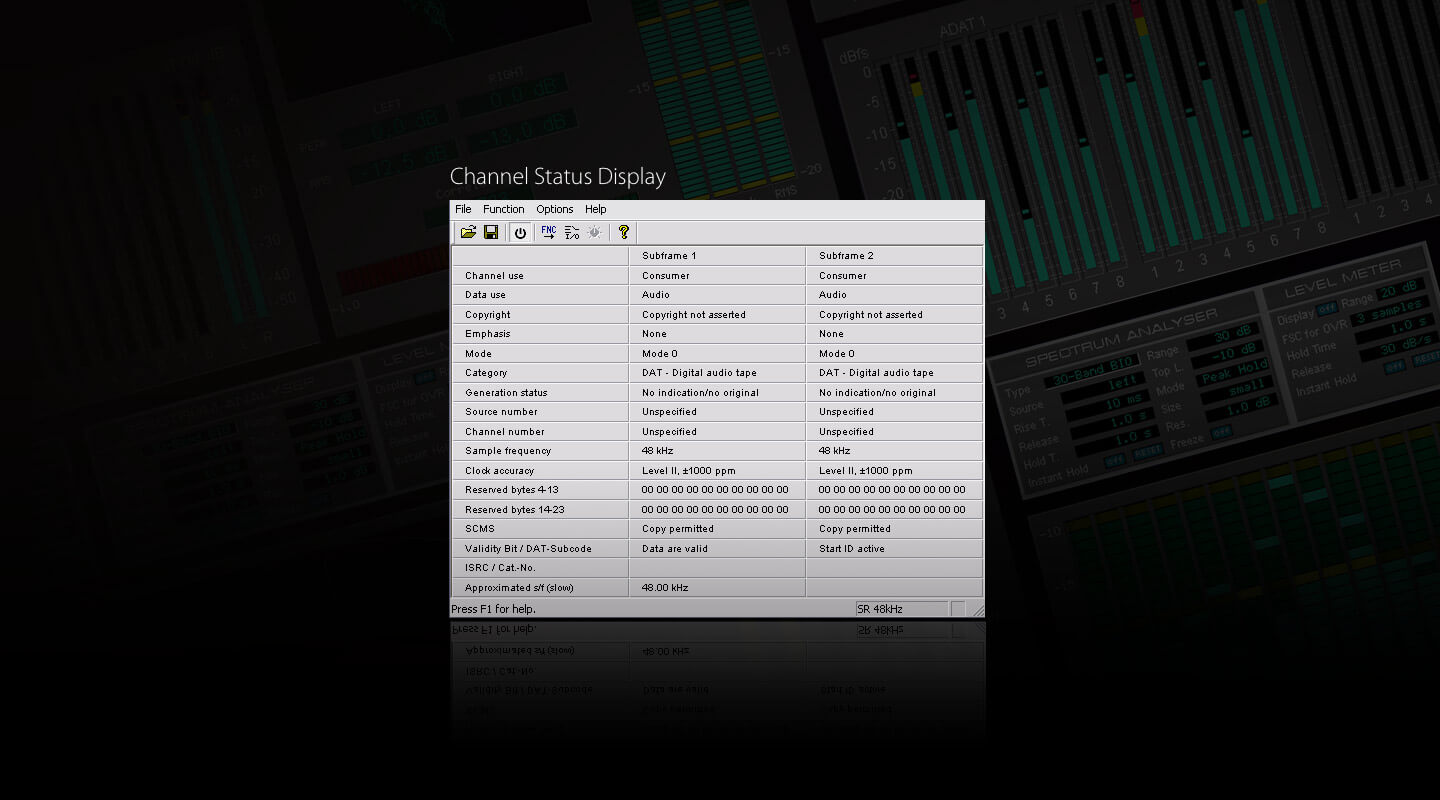
Even if you're not a super-duper technician you can gain useful information from this table. Incompatibilities among digital devices are explained by a set 'Emphasis' or an active copy protection (field 'SCMS'.) No sound from the CD-player? Perhaps the CD is full of scratches, showing 'Data Invalid' (resulting in an automatic mute of the DA-converter.)
When connecting a CD-player or a DAT-recorder parts of the subcode (coded into the user bits) will be shown in the 'Validity-Bit' field. The name changes to 'Validity-Bit/CD-Subcode' or 'Validity-Bit/DAT-Subcode' and shows track number, index and current play time. From the DAT's subcode the Start-ID (not track number!) is presented whenever one occurs. Of course ALL information in the subcode may be decoded thanks to the 32 bit mode of the DIGI96 series, but this is only an example. A professional hard disk recording software might use this information when transferring a 2 hour DAT tape into the PC to automatically set markers at the begin of each track (at each Start-ID.)
Bit Statistic & Noise
This function shows the state of the audio bits. Three states are detected: always low (0), alternating and always high (1.) Alternating means the bit is in use, zero indicates unused bits and permanent one is often caused by a defective AD-converter.
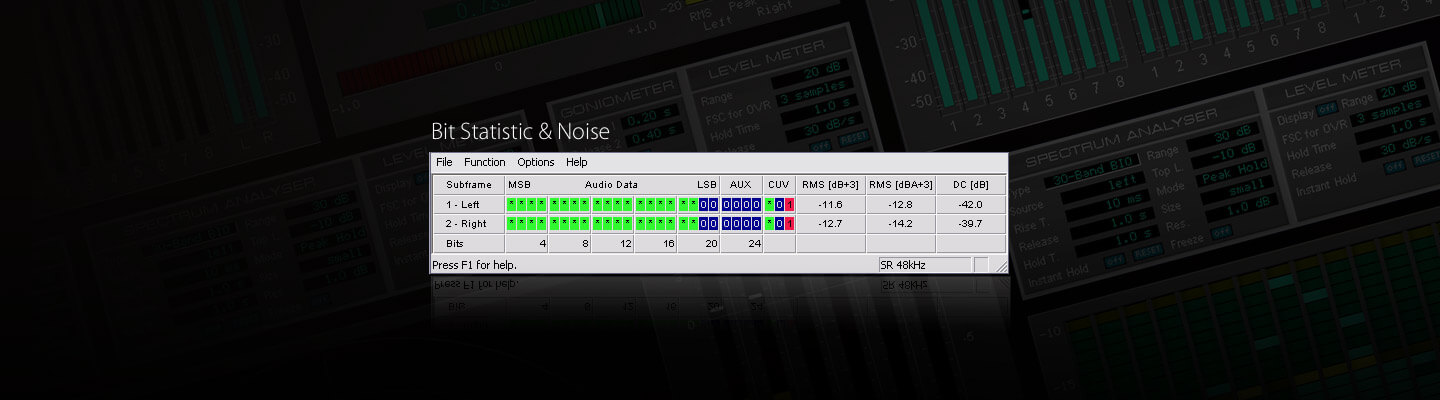
The Bit Statistics allows to determine the real resolution or word length of audio signals, for example at the output of A/D-converters, mixing desks and effects devices. Audio data will be indicated green (normal, bit used), otherwise blue (permanent 0, bit not used). In case of permanent 1 (error or DC) the color changes to red. The normal state of the Channel Status bit and the Validity bit is green, permanent values (red) indicate an error or distorted audio data.
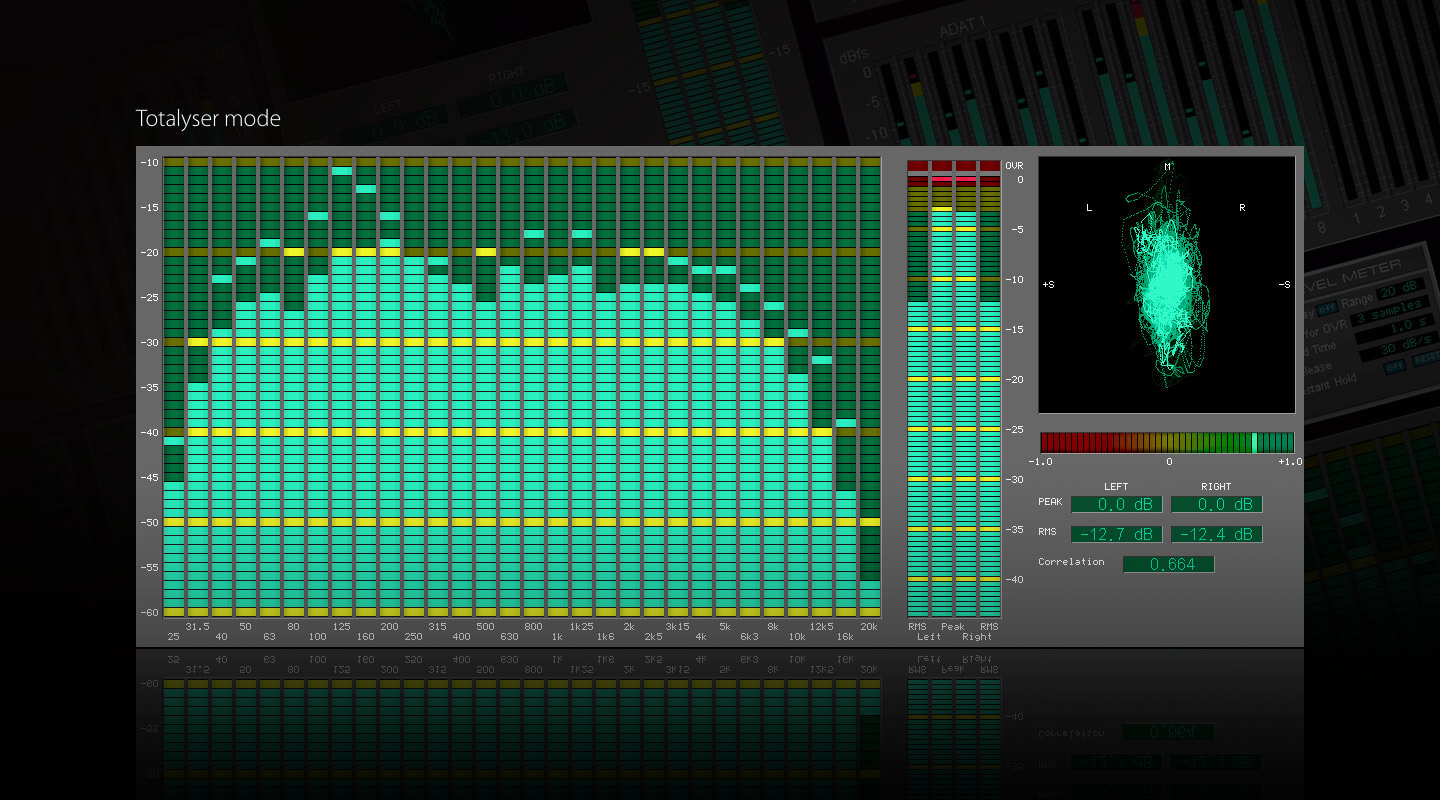
Totalyser: The all-in-one analysis tool
Totalyser is the all-in-one analysis tool, worth a thousand dollars, and free for all RME card users! Totalyser assembles the most important audio meters in one window: a 30-band, 192-kHz capable, widely configurable analyzer, the world's first Goniometer (stereo vector scope) showing the typical afterglow of an oscilloscope tube, and Peak/RMS level meters.
Spectral Analyser and Goniometer are part of DIGICheck for Windows since version 3.0. DIGICheck is easy to use and includes an extensive english online help.
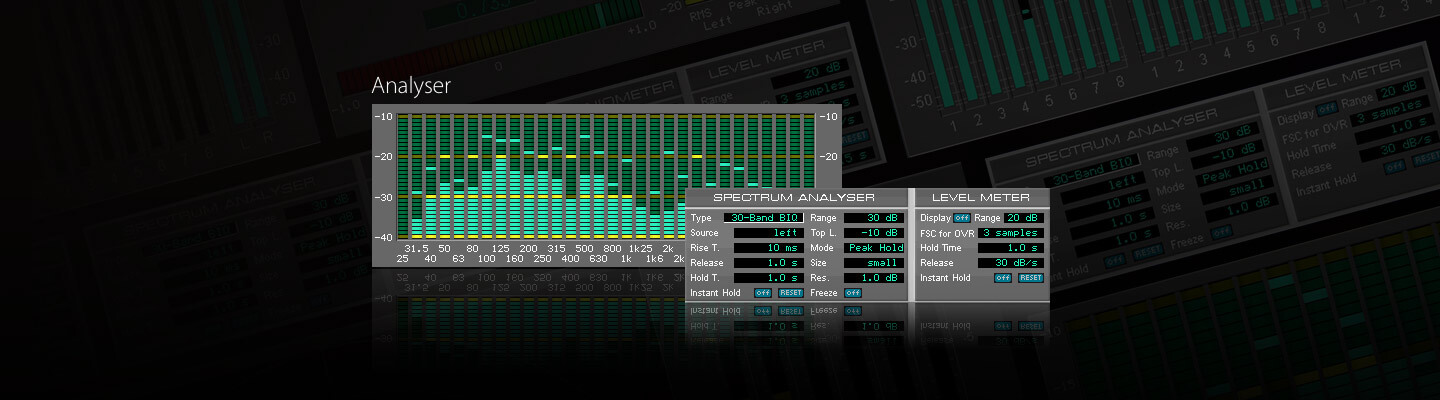
The Analyser
This professional and unique 30-band analyser uses extensive DSP routines as native software code - at a sensationally low CPU load.
As opposed to nearly all current PC-based solutions no FFT (Fast Fourier Transform) is used. This method offers no useable translation of sound into vision. The 'bands' of a FFT have a constant frequency distance, which results in the higher area in numerous bands, in the lower frequencies in very few bands. Some manufacturers try to work around this problem, but even then a sine will show a non-symmetrical display, and an insufficient separation between bands.
RME's Spectral Analyser performs a true bandpass filter calculation, as usual in all professional devices (hardware). The frequency distance between the filters is not linear, but scaled according to human hearing. The highly optimized software allows to run a 30 band analyser with 50 dB range, sharp filters and 100 LEDs per band, without driving the computer to its limits. On a Pentium III 600 MHz the CPU load is around 15%, including the unavoidable graphics load! (Update: P4 2.4 GHz less than 2%).
Thanks to its complete digital operation the Spectral Analyser offers features previously unavailable from analog analysers. These features include freely adjustable rise and release times, a display configurable in many ways, different filters and special display modes. Tanks to the high calculation accuracy of modern CPUs, the Analyser will show levels precisely down to a jaw dropping -140 dBFS.
Notes on Operation
The most important application using a Spectral Analyser is the visualization of frequencies and levels found in music or speech. What you see is what your hear! The Analyser shows levels and frequencies even at the edge of the human ear's abilities. The visual display helps to train your ears, and avoids serious mistakes when mixing to the master tape. Usual studio monitors won't let you hear frequencies below 100 Hz. Simply look on the Analyser to see what's going on in the underground!
Reading the display is not easy for novices, because of the huge amount of information that it shows. But after some training you'll agree that this tool is a precious help in every day work.
More notes on Analysis of Music, Special Display Modes, Sound Measurements, Special Applications and Noise Signals can be found in the extensive online-help of Totalyser.
In order to make level and phase differences between left and right channel visible, oscilloscopes were widely used. The right channel was sent to the X input, the left channel to the Y input, and the tube was turned 45° - ready was a Goniometer. This display can often be found especially in broadcast studios, but also in the post-pro and mastering field. For a long time dedicated devices were very expensive, and were finally pushed aside by Correlation Meters in the mid 80s, which could be manufactured in a much less expensive way. They offer considerably less information, but a phase problem can be easily detected in any case.
In the meantime Goniometers can be found more often again in the form of so-called Vector Scopes, included for free in many software applications. But their quality is, to put it mildly, unsatisfactory. Even those included in expensive 'professional' meter applications have little in common with the original. From our experience, all applications offer quite a bad readability and little expressiveness. After long optimization and implementation of sophisticated algorithms, we succeeded in creating a native software Goniometer, which not only generates very little CPU load, but also surpasses the visualization of the above mentioned clones considerably.
Goniometer
The biggest noticeable difference for you as the user is the fast and direct reaction with a maximum of displayed information. Instead of showing chains of single pixels, RME's Goniometer shows continuous (analogue) lines up to a genuine impenetrable woollen ball.
On top, we have not only implemented the typical afterglow of an oscilloscope tube, which is important for an easy readability, but we have also - which is only possible with a computer - made it variable. For both bright pixels (i. e. more recent ones) and darker pixels (i. e. older ones), there are separately adjustable afterglow times.
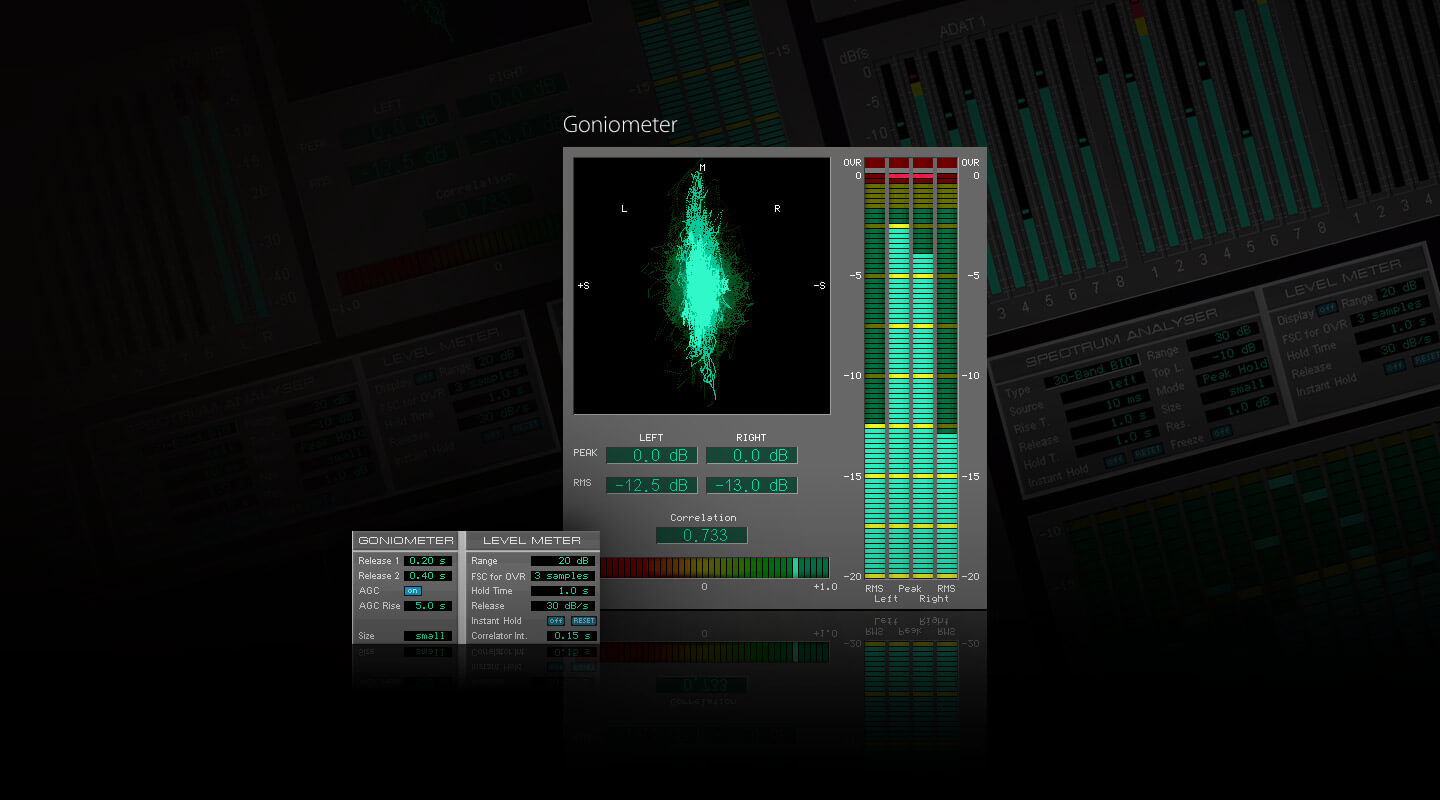
Only with a professional implementation like RME's, a Goniometer makes sense. You will soon discover that the two-dimensional display, in contrast to a correlation meter, reveals a lot of interesting details, and after a short while of getting used to, yields a sensible and useful support for Level Meter and third-octave Spectral Analyser.
More notes on display of phase, display of level and Automatic Gain Control (AGC) can be found in Totalyser's extensive online-help. There you will also find more information about the other functions of Totalyser and DIGICheck, like the Correlation Meter and the Level Meter.
All together - The Totalyser
In Totalyser mode, Analyzer, Goniometer, Correlation Meter and Level Meter can be displayed simultaneously, giving you all the information that you need in one view. As in the single modes, you can again select between three different window sizes, small, medium and large